Precision Agriculture And Crop Monitoring
Precision Agriculture refers to the management of farm inputs and practices based on detailed, site‑specific information. It integrates technologies such as satellite imagery, sensor networks, and data analytics to optimize the timing, plac…
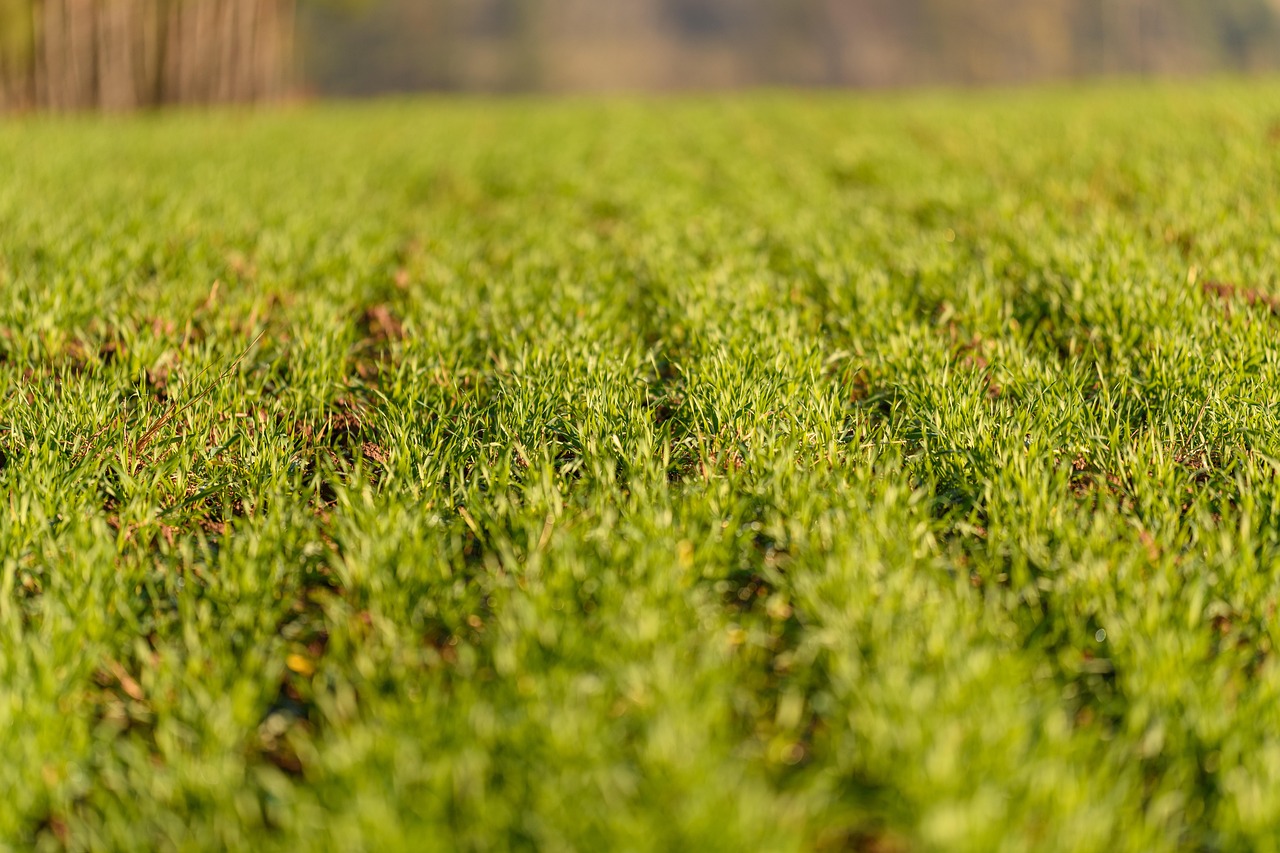
Precision Agriculture refers to the management of farm inputs and practices based on detailed, site‑specific information. It integrates technologies such as satellite imagery, sensor networks, and data analytics to optimize the timing, placement, and quantity of resources like water, fertilizer, and pesticides. By tailoring interventions to the unique conditions of each field zone, growers can increase yields, reduce waste, and minimize environmental impact. For instance, a vineyard owner may use soil moisture maps to irrigate only the driest rows, thereby conserving water while maintaining fruit quality.
Crop Monitoring is the systematic observation and assessment of plant health, growth stage, and environmental stressors throughout the growing season. It relies on a combination of ground‑based sensors, aerial platforms, and satellite platforms to collect data that inform management decisions. Continuous monitoring allows for early detection of disease outbreaks, nutrient deficiencies, or water stress, enabling rapid corrective actions that can prevent yield loss.
Remote Sensing is the acquisition of information about the Earth’s surface without direct contact, typically using electromagnetic radiation captured by satellites or aircraft. In horticulture, remote sensing provides large‑scale, repeatable observations of canopy vigor, leaf area index, and chlorophyll content. Different spectral bands highlight specific plant traits; for example, the near‑infrared band is highly reflective in healthy vegetation, whereas stressed plants show reduced reflectance. A common remote‑sensing product is the Normalized Difference Vegetation Index (NDVI), which quantifies greenness and is used to track phenological development.
Geographic Information System (GIS) is a software framework that stores, analyzes, and visualizes spatial data. GIS integrates layers such as soil type, topography, and historical yield maps, allowing users to overlay sensor readings and generate prescription maps. A horticulture manager might use GIS to identify low‑lying areas prone to frost, then apply protective measures only where needed.
Global Navigation Satellite System (GNSS) provides precise positioning information for field equipment. Modern tractors equipped with GNSS receivers can follow pre‑programmed paths with centimeter‑level accuracy, enabling Variable Rate Technology (VRT) applications. VRT systems adjust input rates on the fly, based on zone‑specific recommendations derived from sensor data. For example, a berry farm may apply fertilizer at 0.8 Kg ha⁻¹ in high‑yield zones and 0.5 Kg ha⁻¹ in marginal zones, reducing excess nutrient runoff.
Unmanned Aerial Vehicle (UAV) or drone platforms have become essential tools for high‑resolution crop monitoring. Equipped with multispectral, thermal, or RGB cameras, UAVs can capture detailed images at sub‑meter resolution, revealing intra‑field variability that satellite sensors may miss. A typical workflow involves planning flight paths, collecting imagery, processing orthomosaics, and extracting vegetation indices for analysis. Drones also support rapid scouting for pest infestations, allowing growers to target treatments precisely.
Satellite Imagery provides broad coverage and frequent revisit times, making it suitable for regional assessments and trend analysis. Platforms such as Sentinel‑2, Landsat 8, and commercial constellations like PlanetScope deliver data at resolutions ranging from 10 m to 3 m. While lower than UAV imagery, satellite data are valuable for long‑term monitoring, drought assessment, and cross‑season comparisons. For example, a horticultural researcher may use Sentinel‑2 NDVI time series to evaluate the impact of a new irrigation schedule over multiple years.
Soil Moisture Sensors measure the volumetric water content of the root zone, providing real-time feedback on soil hydration status. Technologies include time‑domain reflectometry (TDR), capacitance probes, and neutron scattering devices. By integrating sensor data with weather forecasts, irrigation controllers can schedule water applications only when soil moisture falls below a predefined threshold, conserving water and preventing over‑irrigation. In a strawberry field, installing a network of capacitance sensors can reduce irrigation volume by up to 30 % while maintaining fruit size.
Weather Stations collect on‑site meteorological data such as temperature, humidity, wind speed, solar radiation, and precipitation. High‑resolution weather data improve the accuracy of crop growth models and evapotranspiration calculations. Many modern stations transmit data wirelessly to cloud platforms, where it can be combined with satellite observations for decision support. A greenhouse manager may use real‑time temperature and humidity readings to adjust ventilation and heating, ensuring optimal conditions for flower development.
Yield Mapping combines GNSS positioning with harvest data to produce spatial representations of productivity. Yield maps reveal patterns of high and low output, which can be correlated with management practices, soil properties, or pest pressure. In a vineyard, yield mapping may show that vines on the south‑facing slope produce 20 % more grapes than those on the north‑facing slope, prompting targeted canopy management to balance fruit load.
Prescriptive Mapping translates agronomic recommendations into spatially explicit input instructions. These maps are generated by algorithms that integrate sensor data, crop models, and economic parameters. For example, a prescriptive nitrogen map might recommend 150 kg ha⁻¹ for zones with high leaf nitrogen content, while recommending 80 kg ha⁻¹ for zones showing deficiency symptoms. The resulting map is uploaded to the tractor’s VRT system, which automatically adjusts fertilizer flow rates.
Electro‑Conductivity (EC) sensors measure the ability of soil water to conduct electricity, serving as a proxy for salinity and nutrient concentration. High EC values can indicate excessive fertilizer application or salt accumulation, both of which can impair plant growth. In a citrus orchard, EC monitoring helped identify zones where over‑fertilization had increased soil salinity, allowing for corrective leaching and reduced fertilizer use.
Leaf Area Index (LAI) quantifies the total leaf surface area per unit ground area and is a key indicator of canopy development. LAI can be estimated from remote sensing data, such as the red‑edge band of multispectral sensors, or directly measured with ceptometers. Accurate LAI estimates support crop growth models, which predict photosynthetic capacity and water demand. A horticulturalist may use LAI trends to decide when to thin fruit clusters for optimal size.
Thermal Imaging captures the temperature of the plant canopy, providing insight into water stress and transpiration rates. Thermal cameras mounted on UAVs can detect subtle temperature differences that correspond to stomatal closure. In a vineyard, rows exhibiting higher canopy temperature often indicate inadequate irrigation, prompting targeted water delivery to those zones.
Machine Learning algorithms analyze large, heterogeneous datasets to uncover patterns and make predictions. In precision horticulture, supervised learning models such as random forests or gradient boosting machines are trained on historical yield, sensor, and management data to forecast future performance. Unsupervised techniques like clustering can segment fields into management zones based on similarity of soil and crop characteristics. A practical example is using a random forest model to predict disease risk based on humidity, temperature, and leaf wetness sensor data, enabling pre‑emptive fungicide applications.
Deep Learning extends machine learning by employing neural networks with many layers, excelling at image recognition tasks. Convolutional neural networks (CNNs) can automatically detect weed species, fruit maturity, or disease lesions from UAV imagery without manual feature engineering. For instance, a CNN trained on thousands of annotated images of tomato leaves can classify early blight with >90 % accuracy, allowing growers to intervene before the disease spreads.
Internet of Things (IoT) refers to a network of interconnected devices that collect, transmit, and act upon data. In a horticultural setting, IoT devices include soil moisture probes, climate sensors, automated sprayers, and robotic harvesters. These devices communicate via protocols such as LoRaWAN or NB‑IoT, enabling centralized monitoring and control. An IoT‑enabled smart irrigation system can automatically adjust flow rates based on real‑time soil moisture and forecasted rain, reducing labor and water consumption.
Data Fusion combines information from multiple sources—satellite, UAV, ground sensors—to produce richer, more accurate representations of field conditions. By integrating NDVI from satellite with high‑resolution thermal data from drones, analysts can refine stress detection algorithms, reducing false positives. Data fusion also supports multi‑temporal analysis, where observations from different dates are merged to track disease progression or phenological development.
Decision Support System (DSS) provides growers with actionable recommendations based on data analytics, models, and expert rules. A DSS may suggest optimal planting dates, fertilizer schedules, or pest control measures, presenting the information through intuitive dashboards. Effective DSS platforms incorporate user feedback loops, allowing growers to fine‑tune algorithms based on on‑the‑ground observations.
Crop Growth Models simulate the physiological development of plants under varying environmental conditions. Models such as APSIM, DSSAT, or AquaCrop calculate biomass accumulation, water use, and yield potential based on inputs like temperature, solar radiation, and soil moisture. When calibrated with local data, these models become powerful tools for scenario analysis, helping growers evaluate the impact of different management strategies before implementation.
Phenology describes the timing of developmental stages in a plant’s life cycle, such as bud break, flowering, fruit set, and harvest. Accurate phenological tracking is essential for timing interventions like pollination enhancement, pesticide application, or harvest planning. Remote sensing can estimate phenological stages by monitoring changes in spectral indices over time, while ground truth observations validate the remote estimates.
Spatial Resolution defines the size of the smallest feature that can be distinguished in an image. High spatial resolution (e.G., 5 Cm from UAV imagery) reveals fine‑scale variability, whereas coarse resolution (e.G., 30 M from Landsat) captures broader patterns. Selecting the appropriate resolution depends on the management objective; fine resolution is needed for row‑level weed detection, while coarse resolution suffices for regional drought monitoring.
Spectral Resolution refers to the ability of a sensor to distinguish between narrow bands of the electromagnetic spectrum. Multispectral sensors capture a limited number of broad bands (e.G., Red, green, NIR), whereas hyperspectral sensors record hundreds of narrow bands, enabling detection of subtle biochemical differences. Hyperspectral data can differentiate between nutrient deficiencies that appear similar in conventional indices.
Temporal Resolution indicates how often a sensor revisits a location. High temporal resolution (daily or sub‑daily) provides near‑real‑time monitoring, crucial for rapid disease outbreaks. Satellite constellations like PlanetScope deliver daily images, while UAV flights can be scheduled multiple times per week. Balancing temporal frequency with cost and data processing capacity is a key consideration for growers.
Calibration ensures that sensor measurements correspond accurately to physical quantities. Radiometric calibration adjusts for sensor drift and atmospheric effects, while geometric calibration aligns images with ground coordinates. Proper calibration is essential for comparing data across dates or platforms. For example, calibrating a multispectral camera against a reference panel before each flight guarantees consistent NDVI values.
Ground Truthing involves collecting field measurements to validate remote sensing outputs. This may include measuring leaf chlorophyll, soil nutrient levels, or disease incidence at sampled points. Ground truth data are used to train and test predictive models, ensuring that remote observations translate into reliable agronomic insights. A horticulture researcher might sample 30 plants per field zone to correlate NDVI values with actual fruit weight.
Prescription Map is a digital file that encodes variable input rates for equipment such as fertilizer spreaders or sprayers. The map is derived from analysis of sensor data and agronomic models, and it is loaded onto the tractor’s VRT controller. The controller then modulates flow rates in real time as the machine moves across the field. Accurate prescription maps depend on precise GNSS positioning and timely data updates.
Yield Component refers to the individual factors that together determine final production, such as fruit number, size, and weight. Monitoring each component helps identify the limiting factors in a crop. For example, a low overall yield in a raspberry farm may be traced to a reduced fruit set rather than insufficient nutrient supply, guiding the grower to focus on pollination practices.
Canopy Cover is the proportion of ground covered by plant foliage, often estimated using aerial imagery. High canopy cover typically indicates vigorous growth, but excessive density can lead to shading and disease pressure. Managing canopy structure through pruning or trellising can improve light penetration and air flow, enhancing fruit quality.
Soil Electrical Conductivity (ECa) maps are generated using electromagnetic induction tools that measure the soil’s ability to conduct an alternating current. These maps reveal spatial patterns of soil texture, moisture, and salinity. In a citrus grove, zones with high ECa may correspond to sandy soils with lower water holding capacity, prompting differentiated irrigation regimes.
Water Use Efficiency (WUE) quantifies the amount of biomass or yield produced per unit of water consumed. Improving WUE is a central goal of precision irrigation. Techniques such as deficit irrigation, where water is applied below full‑crop demand during non‑critical growth stages, can enhance WUE while maintaining acceptable yields. Monitoring WUE requires accurate measurements of evapotranspiration, often derived from weather data and crop models.
Evapotranspiration (ET) combines evaporation from soil and transpiration from plants. ET is a key driver of irrigation scheduling. It can be estimated using the Penman‑Monteith equation, which incorporates temperature, humidity, wind speed, and solar radiation. Remote sensing provides ET estimates at the field scale, enabling growers to allocate water where it is most needed.
Decision Threshold is a predefined value that triggers a management action. For example, a soil moisture threshold of 15 % volumetric water content may initiate irrigation. Selecting appropriate thresholds requires understanding crop tolerance, economic considerations, and environmental constraints. Thresholds can be static (fixed) or dynamic (adjusted based on weather forecasts).
Artificial Intelligence (AI) encompasses a broad set of computational techniques that enable machines to mimic human reasoning. In horticulture, AI is applied to image classification, anomaly detection, predictive analytics, and autonomous machinery. AI systems learn from historical data, improving their accuracy over time and allowing for increasingly sophisticated decision support.
Automation involves the use of robotics or control systems to perform tasks without human intervention. Examples include autonomous weeding robots that navigate rows using computer vision, or robotic harvesters that pick fruit based on maturity detection algorithms. Automation reduces labor costs and can increase operational consistency.
Robotics integrates mechanical design, sensors, and AI to perform agricultural tasks. In precision horticulture, robots may conduct tasks such as pruning, thinning, or targeted pesticide application. Designing horticultural robots requires consideration of plant architecture, terrain variability, and safety protocols to avoid damaging delicate crops.
Digital Twin is a virtual replica of a physical farm that incorporates real‑time sensor data, weather forecasts, and agronomic models. The digital twin enables simulation of management scenarios, risk assessment, and optimization before field implementation. A digital twin of a greenhouse can predict the effect of adjusting temperature setpoints on fruit quality, allowing the manager to test strategies virtually.
Edge Computing processes data locally on devices such as sensor nodes or field gateways, reducing latency and bandwidth requirements. Edge analytics can trigger immediate actions, such as opening a valve when soil moisture falls below a threshold, without waiting for cloud processing. This capability is critical for time‑sensitive interventions like frost protection.
Cloud Computing provides scalable storage and processing power for large datasets generated by remote sensing, IoT networks, and machine learning models. Cloud platforms host data warehouses, analytical tools, and collaborative dashboards accessible to multiple stakeholders. However, reliance on cloud services introduces considerations of data security, connectivity, and cost.
Data Governance defines policies for data ownership, privacy, quality, and accessibility. In a horticultural enterprise, clear data governance ensures that sensor data, farm records, and analytical outputs are managed responsibly, protecting proprietary information while enabling data sharing across research partners.
Standardization of data formats and protocols facilitates interoperability between devices and software. Common standards such as ISO 11783 (ISOBUS) for agricultural equipment communication enable seamless integration of VRT controllers, GNSS receivers, and farm management software. Standardization reduces integration costs and promotes technology adoption.
Spatial Interpolation estimates values at unsampled locations based on measurements from surrounding points. Techniques include inverse distance weighting, kriging, and spline interpolation. Interpolation is used to generate continuous soil moisture maps from a limited sensor network, providing the basis for zone‑specific irrigation prescriptions.
Geostatistics applies statistical methods to spatial data, quantifying variability and correlation structures. Semivariograms describe how similarity between measurements changes with distance, informing the selection of interpolation techniques. Geostatistical analysis helps identify hotspots of disease or nutrient deficiency that may not be apparent from raw sensor readings.
Yield Forecasting predicts future production based on current observations, weather forecasts, and crop models. Accurate forecasts support market planning, logistics, and financial risk management. Machine learning models that combine satellite NDVI trends with historical yield data can deliver forecasts weeks ahead of harvest, giving growers a strategic advantage.
Risk Assessment evaluates the probability and impact of adverse events such as pest outbreaks, extreme weather, or market price fluctuations. By quantifying risk, growers can implement mitigation strategies, such as diversifying varieties, adopting protective structures, or purchasing crop insurance. Data‑driven risk assessment leverages historical incident records and predictive analytics.
Economic Threshold defines the pest population level at which the cost of damage equals the cost of control measures. Determining accurate economic thresholds requires integrating pest monitoring data with crop value, control efficacy, and environmental considerations. For example, an aphid density of 100 aphids per leaf may be the threshold for initiating a biocontrol spray in a lettuce field.
Precision Spraying uses variable rate technology to apply pesticides only where pest pressure exceeds the economic threshold. Sensors such as optical weed detectors or pest traps guide the sprayer’s nozzle opening, reducing chemical usage and minimizing off‑target drift. In a vineyard, precision spraying can limit fungicide applications to the most vulnerable rows, preserving beneficial insects.
Variable Rate Irrigation (VRI) adjusts water delivery rates across a field based on spatially variable needs. VRI systems use pressure‑controlled emitters or pivot sections that can be independently regulated. Integration with soil moisture maps ensures that each zone receives the exact amount of water required for optimal growth, enhancing water productivity.
Sensor Fusion merges data from heterogeneous sensors—such as combining temperature, humidity, and leaf wetness—to generate a more robust indicator of disease risk. Sensor fusion algorithms weigh each input according to reliability and relevance, producing a composite risk score that can trigger early warnings.
Artificial Neural Network (ANN) mimics the structure of biological neurons, consisting of interconnected layers that transform inputs into outputs. ANNs are employed in horticulture for tasks like predicting fruit quality based on spectral signatures or estimating soil nutrient levels from multispectral data. Training an ANN requires large labeled datasets and careful tuning to avoid overfitting.
Overfitting occurs when a model learns noise in the training data rather than the underlying pattern, resulting in poor performance on new data. Techniques such as cross‑validation, regularization, and pruning are used to mitigate overfitting in machine learning models applied to agricultural datasets.
Cross‑validation partitions data into training and testing subsets multiple times to evaluate model robustness. In k‑fold cross‑validation, the dataset is divided into k subsets; each subset serves as a test set once while the remaining k‑1 subsets form the training set. This approach provides a reliable estimate of model accuracy before deployment.
Feature Engineering involves creating informative variables from raw data to improve model performance. Examples include calculating the difference between NDVI and the red‑edge index, or aggregating hourly temperature data into degree‑day totals. Thoughtful feature engineering can dramatically increase the predictive power of machine‑learning models in horticulture.
Data Augmentation expands training datasets by applying transformations such as rotation, scaling, or noise injection to existing images. Augmentation is especially valuable when limited labeled data are available for deep‑learning tasks like disease detection, helping the model generalize to new field conditions.
Model Interpretability refers to the ability to understand how a model reaches its predictions. Techniques such as SHAP values or partial dependence plots reveal which variables most influence outcomes, providing transparency for growers and regulators. Interpretable models foster trust and facilitate decision‑making.
Scalability describes the capacity of a technology or system to handle increasing data volumes, field sizes, or numbers of users without degradation of performance. Cloud‑based analytics platforms must be scalable to support large plantation operations that generate terabytes of sensor and imagery data each season.
Spatial Analytics encompasses methods for analyzing geographic patterns, including hotspot analysis, cluster detection, and trend mapping. Spatial analytics can identify disease clusters in a strawberry field, enabling targeted interventions that limit spread and reduce pesticide usage.
Temporal Analytics examines how variables change over time, using techniques such as time‑series decomposition, anomaly detection, and forecasting. Monitoring NDVI curves throughout a growing season reveals deviations from expected growth patterns, signaling potential stress factors.
Smart Farming is a broader term that includes precision agriculture, IoT, AI, and data‑driven management practices. Smart farming aims to create resilient, efficient, and sustainable production systems by leveraging technology to make informed decisions at every stage of the horticultural value chain.
Digital Agriculture overlaps with smart farming but emphasizes the integration of digital tools—software platforms, mobile apps, and data services—into everyday farm operations. Digital platforms often provide dashboards, alerts, and reporting functions that synthesize sensor data, weather forecasts, and market information.
Farm Management Information System (FMIS) centralizes data from multiple sources—field operations, finances, inventory, and compliance—into a unified interface. FMIS facilitates traceability, regulatory reporting, and performance benchmarking, supporting both operational efficiency and strategic planning.
Traceability tracks the movement of products from field to consumer, recording each step of the supply chain. Precision agriculture contributes to traceability by documenting input applications, harvest dates, and quality metrics at the field level, enabling certification schemes and consumer confidence.
Regulatory Compliance involves adhering to laws and standards governing pesticide use, water management, and food safety. Precision technologies help growers demonstrate compliance by providing documented evidence of targeted applications, reduced runoff, and accurate record‑keeping.
Carbon Footprint measures the total greenhouse gas emissions associated with agricultural activities. By optimizing input use and reducing fuel consumption through VRT and autonomous equipment, growers can lower their carbon footprint and meet sustainability targets.
Life Cycle Assessment (LCA) evaluates the environmental impacts of a product from cradle to grave. In horticulture, LCA may assess the benefits of precision irrigation versus conventional practices, quantifying water savings, energy use, and emissions.
Biosecurity refers to measures that prevent the introduction and spread of pests and diseases. Sensor networks that detect early signs of infestation, combined with rapid response protocols, strengthen biosecurity on horticultural farms.
Integrated Pest Management (IPM) combines biological control, cultural practices, monitoring, and targeted chemical applications to manage pests sustainably. Precision monitoring provides the data needed to implement IPM effectively, ensuring interventions are timed and placed precisely.
Phenotyping involves measuring observable plant traits, often using high‑throughput imaging platforms. In horticulture, phenotyping can assess fruit size, color, or shape at early developmental stages, supporting breeding programs and quality control.
Genomic Selection uses DNA markers and statistical models to predict the breeding value of plants. While primarily a breeding tool, genomic selection can be integrated with precision agriculture by aligning genotype data with field performance metrics, accelerating the development of climate‑resilient varieties.
Decision Tree is a machine‑learning model that splits data based on feature thresholds, creating a flowchart‑like structure for classification or regression. Decision trees are intuitive and can be visualized for growers to understand the logic behind recommendations.
Random Forest combines multiple decision trees to improve predictive accuracy and reduce overfitting. Random forests are widely used in horticulture for tasks such as predicting disease risk or estimating yield based on multi‑sensor inputs.
Gradient Boosting builds an ensemble of weak learners sequentially, where each new model corrects errors of the previous one. Gradient boosting algorithms, such as XGBoost, have demonstrated high performance in agricultural predictive modeling, particularly when handling heterogeneous data.
Support Vector Machine (SVM) separates data points with a hyperplane that maximizes the margin between classes. SVMs can be applied to classify weed species from spectral signatures or to detect disease lesions in leaf images.
Clustering groups data points based on similarity without predefined labels. K‑means clustering can segment a field into management zones by grouping soil properties and yield data, informing variable rate prescriptions.
Dimensionality Reduction reduces the number of variables while preserving essential information. Techniques such as Principal Component Analysis (PCA) are used to compress hyperspectral data into a few informative components, simplifying model training and interpretation.
Outlier Detection identifies anomalous data points that deviate significantly from the norm. Outlier detection is crucial for quality control in sensor networks, where faulty readings can mislead decision‑support algorithms.
Time‑Series Analysis examines data points collected sequentially over time, identifying trends, seasonality, and irregularities. Applying time‑series analysis to weather and NDVI data helps forecast stress events and plan interventions.
Geofence defines a virtual perimeter around a geographic area, enabling location‑based alerts and actions. A geofence around a greenhouse can trigger heating systems when external temperature drops below a set point, ensuring optimal growing conditions.
Digital Soil Mapping creates spatially explicit predictions of soil properties using machine learning and environmental covariates. Accurate soil maps support site‑specific management, guiding fertilizer placement and irrigation scheduling.
Crop Health Index aggregates multiple spectral and environmental variables into a single metric that reflects plant vigor. The index can be calibrated against yield to provide a quick visual indicator of field performance.
Plant Stress Detection uses thermal, spectral, or physiological sensors to identify water, nutrient, or pest stress before symptoms become visible. Early detection enables proactive management, reducing yield penalties.
Harvest Optimization leverages sensor data and predictive models to determine the ideal harvest window, balancing fruit maturity, market demand, and labor availability. In a blueberry farm, real‑time firmness sensors can signal when berries reach peak quality.
Post‑Harvest Quality Monitoring extends precision concepts to storage and distribution, using sensors to track temperature, humidity, and ethylene levels. Maintaining optimal conditions preserves fruit quality and extends shelf life.
Autonomous Navigation enables robots and vehicles to move through rows without human guidance, relying on GPS, LiDAR, and computer vision. Robust navigation algorithms must handle obstacles, variable lighting, and uneven terrain.
LiDAR (Light Detection and Ranging) emits laser pulses and measures the reflected signal to generate 3D point clouds. LiDAR data reveal canopy structure, plant height, and terrain elevation, supporting precise canopy management and terrain‑aware routing.
Multispectral Camera captures images in several discrete spectral bands, typically including red, green, blue, near‑infrared, and red‑edge. Multispectral data are the foundation for indices like NDVI, GNDVI, and NDRE, which inform crop health assessments.
Hyperspectral Camera records hundreds of narrow spectral bands, providing detailed information on leaf chemistry, water content, and disease symptoms. Though data‑intensive, hyperspectral imaging can differentiate between nutrient deficiencies that appear similar in multispectral images.
RGB Camera records standard red, green, and blue channels, useful for visual inspection, fruit counting, and canopy coverage estimation. While less informative than multispectral or hyperspectral sensors, RGB cameras are cost‑effective and widely available.
Thermal Camera measures emitted infrared radiation, converting it to temperature readings. Thermal imagery is valuable for detecting water stress, frost risk, and disease‑induced temperature changes.
Data Pipeline describes the sequence of steps that move raw data from acquisition through processing, storage, analysis, and visualization. A well‑designed pipeline ensures data integrity, reduces latency, and supports scalable analytics.
Metadata provides contextual information about data, such as acquisition date, sensor type, spatial resolution, and processing steps. Accurate metadata is essential for data reuse, integration, and reproducibility.
Open Data initiatives encourage sharing of non‑proprietary datasets, fostering collaboration and innovation. Open satellite imagery, weather data, and soil surveys enable growers to build robust models without high upfront costs.
Proprietary Data is owned by a specific entity and may require licensing for use. Commercial satellite providers often sell high‑resolution imagery, offering higher spatial detail at a cost. Understanding licensing terms is important for compliance.
Data Latency refers to the time delay between data collection and availability for analysis. Low latency is critical for time‑sensitive decisions such as disease alerts; high‑latency data may still be valuable for longer‑term planning.
Data Security protects sensitive information from unauthorized access or tampering. Encryption, authentication, and access controls are essential components of a secure agricultural data ecosystem.
Data Privacy concerns the handling of personal or proprietary information, ensuring that owners retain control over their data. Privacy regulations may affect how farm data can be shared with third‑party service providers.
Edge Device is a sensor or controller that performs computation locally, often to reduce bandwidth usage or enable real‑time responses. Edge devices can execute simple analytics, such as threshold‑based irrigation triggers, before sending summarized data to the cloud.
Gateway aggregates data from multiple edge devices, providing connectivity to the cloud or local servers. Gateways may also perform data preprocessing, such as filtering or compression, to optimize transmission.
Application Programming Interface (API) defines how software components interact, enabling integration of different platforms and services. APIs allow a farm management system to retrieve weather forecasts, submit sensor data, or request model predictions programmatically.
Software Development Kit (SDK) provides tools and libraries for developers to build custom applications that interface with hardware or cloud services. An SDK for a drone platform may include functions for flight planning, image acquisition, and data download.
Interoperability ensures that different hardware and software components can work together seamlessly. Adhering to common communication standards and data formats promotes interoperability, reducing vendor lock‑in.
Scalable Architecture designs systems that can grow in capacity and functionality without major redesign. Cloud‑native microservices, containerization, and serverless computing are architectural patterns that support scalability in agricultural analytics.
Real‑Time Analytics processes data as it arrives, delivering immediate insights. Real‑time analytics are essential for responsive actions such as activating frost fans or adjusting nutrient delivery on the fly.
Batch Processing groups data into large sets for periodic analysis, suitable for tasks like annual yield reporting or long‑term trend analysis. Batch processing can leverage high‑performance computing resources to handle massive datasets.
Visualization translates complex data into intuitive graphics, such as heat maps, time‑series plots, or 3D terrain models. Effective visualization helps growers quickly grasp field conditions and make informed decisions.
Dashboard consolidates key performance indicators, alerts, and control options into a single interface. Dashboards can be accessed via web browsers or mobile apps, providing flexibility for managers on‑site or off‑site.
Alert System generates notifications based on predefined conditions, such as low soil moisture, disease risk exceeding a threshold, or equipment malfunction. Alerts can be delivered via SMS, email, or push notifications, ensuring timely response.
Machine‑to‑Machine Communication enables devices to exchange data directly, facilitating coordinated actions. For example, a soil sensor can signal a nearby irrigation valve to open, bypassing central control for faster response.
Farm Robotics includes autonomous tractors, sprayers, harvesters, and weeding robots. These machines integrate navigation, perception, and actuation to perform tasks with minimal human oversight, increasing efficiency and reducing labor demands.
Robotic Arm manipulates objects with multiple degrees of freedom, useful for delicate tasks such as pruning or selective fruit picking. Designing a robotic arm for horticulture requires careful consideration of payload, reach, and force control to avoid damaging plants.
Swarm Robotics employs multiple simple robots that cooperate to achieve complex objectives, such as distributed weed removal or soil sampling. Swarm approaches can cover large areas quickly and provide redundancy, enhancing robustness.
Robotic Vision equips robots with cameras and image‑processing algorithms to recognize objects, navigate obstacles, and assess plant health. Vision systems must handle variable lighting, occlusions, and diverse plant morphologies.
Actuator converts electrical signals into mechanical motion, controlling devices such as valves, motors, and sprayer nozzles. Precise actuator control is essential for variable rate applications, ensuring accurate delivery of inputs.
Feedback Loop monitors system performance and adjusts actions to maintain desired outcomes. In a closed‑loop irrigation system, soil moisture sensors provide feedback that modulates pump speed, maintaining target moisture levels.
Predictive Maintenance uses sensor data and analytics to anticipate equipment failures before they occur. Monitoring vibration, temperature, and hydraulic pressure can signal wear in a tractor’s drivetrain, allowing scheduled maintenance that minimizes downtime.
Digital Phenology Calendar aligns observed phenological stages with climate data, helping growers plan interventions such as frost protection or pollination augmentation. The calendar can be updated dynamically as remote‑sensing observations refine stage estimates.
Crop Simulation models the interaction of genetics, environment, and management to predict growth trajectories. Simulation tools enable “what‑if” analyses, testing the impact of alternative practices on yield, resource use, or risk exposure.
Carbon Sequestration refers to the capture and storage of atmospheric CO₂ in plant biomass and soil organic matter. Precision nutrient management can enhance carbon sequestration by promoting healthy root development and minimizing disturbance.
Water Quality Monitoring tracks parameters such as pH, dissolved oxygen, and contaminant levels in irrigation water sources. Sensor networks can detect changes that affect crop health or regulatory compliance, prompting adjustments to water use or treatment.
Soil Health Index aggregates multiple soil indicators—organic matter, pH, compaction, microbial activity—into a single score that reflects overall soil function. Monitoring the index over time helps assess the impact of management practices on long‑term sustainability.
Field Edge Detection uses image processing to delineate the boundary between cultivated and uncultivated land. Accurate field edges are required for mapping, VRT application, and compliance with land‑use regulations.
Canopy Temperature Differential measures the temperature difference between the canopy and ambient air, serving as an indicator of transpiration efficiency. A larger differential may signal water stress, guiding targeted irrigation.
Crop Water Stress Index (CWSI) quantifies the degree of water deficit based on canopy temperature, ambient temperature, and humidity. CWSI values guide irrigation scheduling, helping maintain optimal water status without excess application.
Leaf Wetness Sensor records the presence of moisture on leaf surfaces, a key factor in disease development. Integrating leaf wetness data with temperature and humidity improves disease risk models for pathogens such as downy mildew.
Plant Canopy Spectroscopy measures the spectral reflectance of the canopy to infer biochemical properties such as chlorophyll, nitrogen, and water content. Spectroscopic techniques can detect subtle nutrient deficiencies before visual symptoms appear.
Key takeaways
- It integrates technologies such as satellite imagery, sensor networks, and data analytics to optimize the timing, placement, and quantity of resources like water, fertilizer, and pesticides.
- Continuous monitoring allows for early detection of disease outbreaks, nutrient deficiencies, or water stress, enabling rapid corrective actions that can prevent yield loss.
- Different spectral bands highlight specific plant traits; for example, the near‑infrared band is highly reflective in healthy vegetation, whereas stressed plants show reduced reflectance.
- GIS integrates layers such as soil type, topography, and historical yield maps, allowing users to overlay sensor readings and generate prescription maps.
- Modern tractors equipped with GNSS receivers can follow pre‑programmed paths with centimeter‑level accuracy, enabling Variable Rate Technology (VRT) applications.
- Equipped with multispectral, thermal, or RGB cameras, UAVs can capture detailed images at sub‑meter resolution, revealing intra‑field variability that satellite sensors may miss.
- For example, a horticultural researcher may use Sentinel‑2 NDVI time series to evaluate the impact of a new irrigation schedule over multiple years.